Data

Reports, dashboards and business intelligence

Reports help your client renew. He needs to see the results you delivered, with concrete data.

Agency that does not show results loses the customer in the third month. Here you have the panel ready, with your brand, to send each month without mounting spreadsheet.

Dashboard

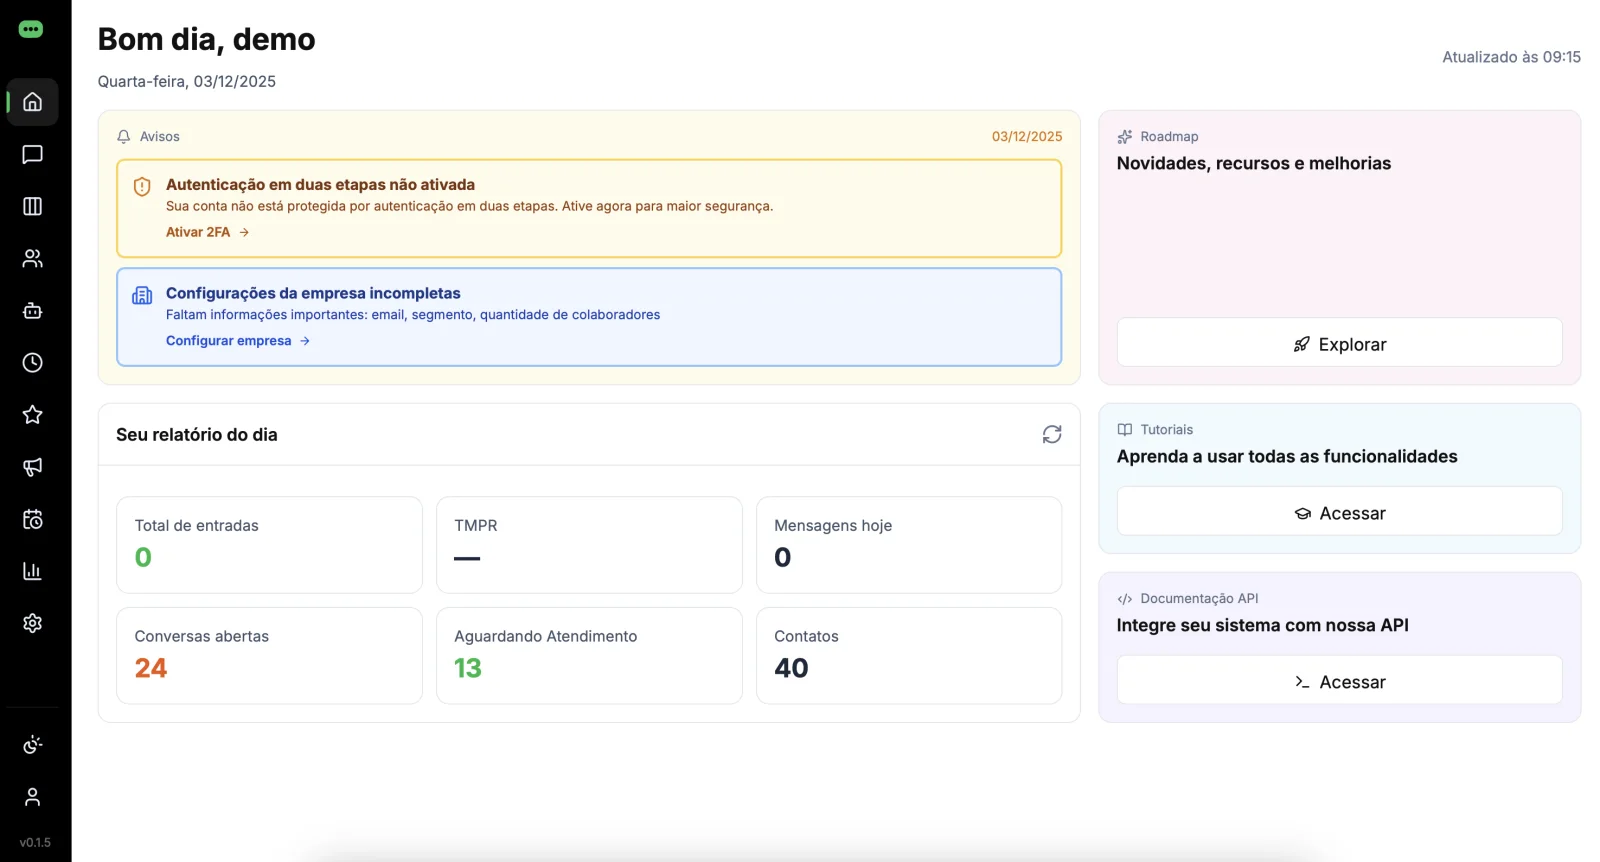
The panel that opens together with the day

Attentions, response times, conversions and productivity per assistant, updated in real time. Each company sees only its own numbers.

  • Time of first response By assistant and sector
  • Step conversions of the funnel
  • Volume per channel The origin of the lead
  • Comparison Between periods
CRM Dashboard with real-time metrics
Dashboard with Operation Indicators
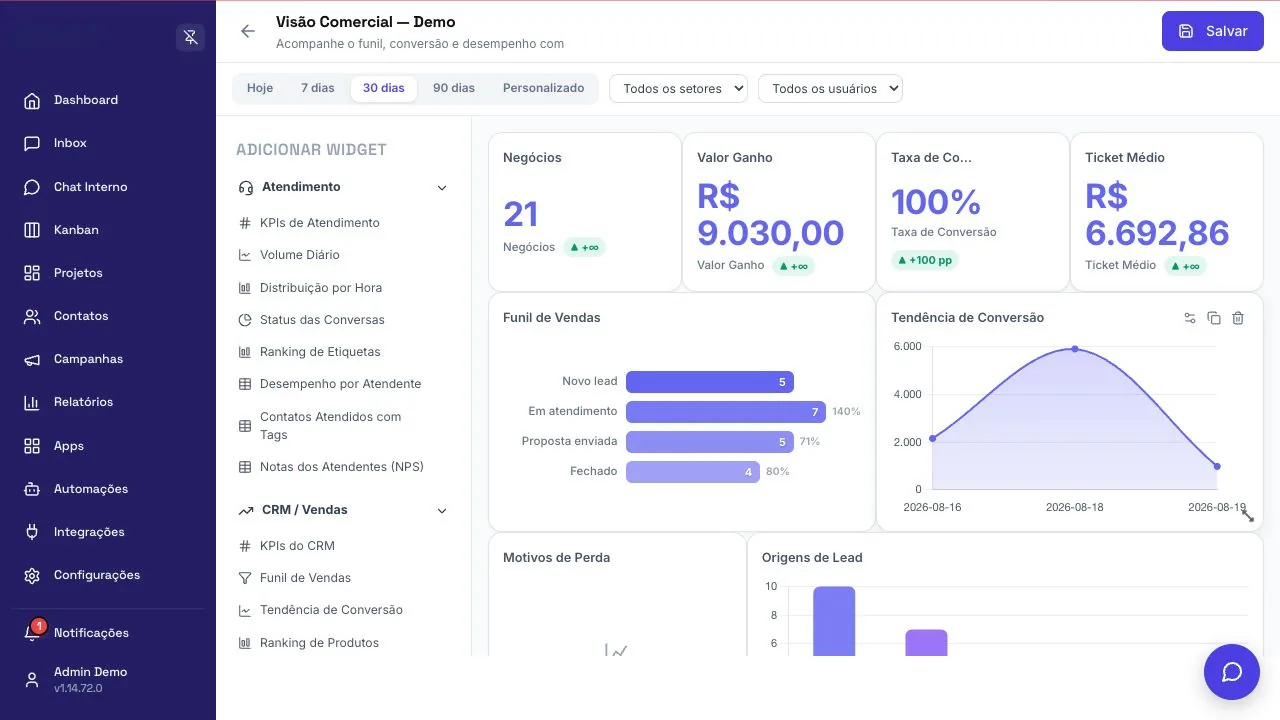
BI Builder

Panels mounted by those who understand the business

In addition to the ready reports, a builder to create the panel that that specific client requests and share by link, without giving access to the entire CRM.

  • Panel Editor with graphs and indicators
  • Panel library Reusable between customers
  • Share by linkWith the identity of the company
  • Export and connection with Power BI
BI Panel Editor
BI Panel Builder
Keep exploring

Other areas of the platform

FunnelOps white-label

You want to deliver all this with your brand?

Tell us what your operation is like today. Our team mounts the demonstration with the stage of your market.